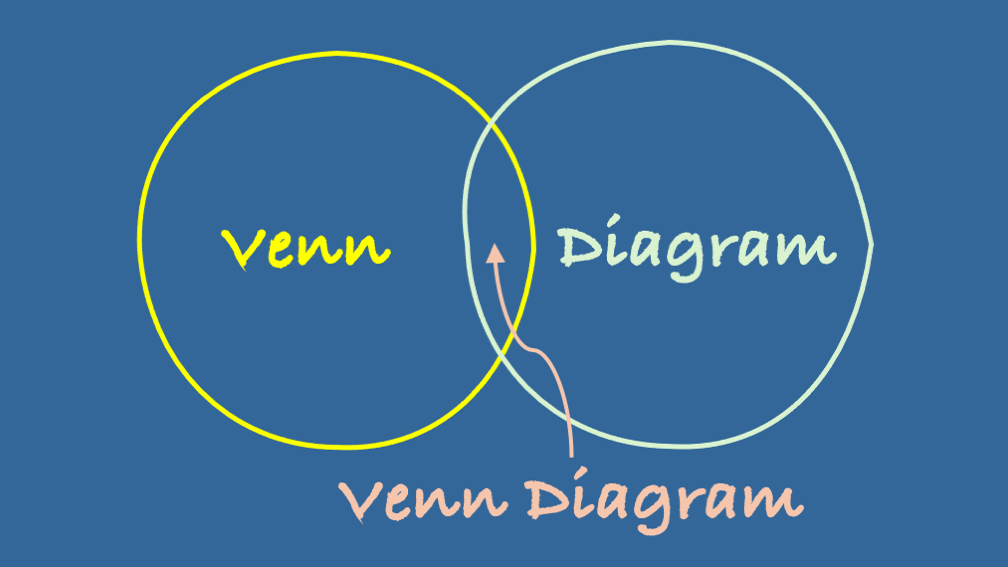
Out of all the disciplines in an SME or large business, Marketing is arguably the department that reaches for a Venn diagram more than any other. This isn’t mere coincidence – it’s because marketing professionals deal with complex relationships between audiences, channels, and concepts that need visual clarity.
Let me explore why Marketing has embraced John Venn’s 1880s invention so enthusiastically, and share some examples where these overlapping circles have delivered brilliant insights, spectacular failures, and the occasionally hilarious results that make our industry so wonderfully unpredictable.
Why Marketing Teams Are Venn Diagram Champions
Marketing professionals face a fundamental challenge that other business functions rarely encounter at the same scale: understanding and visualising multiple, intersecting relationships simultaneously[1][2][3]. Whether it’s audience segmentation, competitive analysis, or campaign planning, marketing decisions require understanding where different groups, concepts, or strategies overlap.
Consider what a typical marketing team needs to analyse on any given day: customer demographics, behavioural patterns, channel preferences, product features, competitive advantages, and campaign objectives. Each of these exists as distinct sets with their own characteristics, but the magic happens in the intersections where they overlap[4][5].
The Audience Segmentation Sweet Spot
The most common use of Venn diagrams in marketing is audience segmentation[6][7]. Marketing teams regularly create diagrams showing overlapping circles for different customer segments. For instance, a fitness app might have circles for “gym enthusiasts,” “busy professionals,” and “health-conscious seniors.” The overlapping areas reveal cross-segment opportunities – perhaps “time-poor professionals who value efficiency” becomes a prime target for quick workout features[8][9].
This visual approach helps marketing teams identify their “sweet spot” – that central area where multiple customer needs intersect[10]. It’s far more intuitive than spreadsheets full of demographic data, and crucially, it helps teams spot opportunities they might otherwise miss.
Competitive Analysis Made Simple
Marketing departments also use Venn diagrams to compare their offerings against competitors[11][12]. A software company might create circles representing their features, competitor A’s features, and competitor B’s features. The overlapping areas show common ground, while the unique sections highlight differentiation opportunities.
This visual method transforms complex competitive intelligence into actionable insights. It’s one thing to have a list of competitor features; it’s another to see graphically where your product sits in relation to the market landscape[13][14].
Campaign Channel Strategy
Modern marketing involves multiple channels – social media, email, content marketing, paid advertising, and traditional media. Venn diagrams help visualise which audiences exist across different channels and where campaigns should focus their efforts[15][16].
A marketing team might discover that their “engaged email subscribers” and “social media followers” circles have surprisingly little overlap, suggesting untapped potential for cross-channel promotion[17].
The Good: Brilliant Venn Diagram Success Stories
The Golden Circle of Content Strategy
One of the most successful applications comes from content marketing strategy[18]. The approach uses a three-circle Venn diagram showing “what your audience cares about,” “what your brand cares about,” and “what you can create well.” The sweet spot in the centre represents your content strategy pillars – topics that engage your audience, align with your brand values, and play to your creative strengths.
This framework has helped countless brands focus their content efforts rather than trying to cover everything. Companies using this approach report higher engagement rates and clearer brand positioning[18].
Market Research Excellence
Market research firms have achieved remarkable results using four-way Venn diagrams to analyse customer preferences across multiple product categories[19]. One e-commerce platform used this approach to compare customer segments based on demographics and behaviour. By identifying the intersection of “high spenders,” “frequent shoppers,” and “brand advocates,” they discovered a previously overlooked segment that became their most profitable customer group.
The visual clarity helped stakeholders understand complex customer data immediately, leading to more targeted marketing campaigns and a 35% increase in customer lifetime value for the identified segment[19].
The Sports Marketing Sweet Spot
A particularly clever application comes from sports marketing[3]. One agency uses a three-circle Venn diagram showing “the sponsor’s objectives,” “the rights holder’s needs,” and “the target consumer’s interests.” Successful partnerships exist only in the centre where all three circles overlap.
This framework has helped avoid partnerships that serve only one or two parties, leading to more successful long-term relationships and measurable ROI improvements. The visual nature makes it easy for all stakeholders to understand and commit to shared objectives[3].
The Bad: When Venn Diagrams Go Wrong
The Pepsi Disaster
While not directly about a Venn diagram failure, Pepsi’s infamous 2017 Kendall Jenner advertisement represents a classic case of what happens when marketing teams fail to properly map stakeholder interests[20][21]. The campaign appeared to assume overlap between “protest imagery,” “celebrity endorsement,” and “soft drink consumption” without considering the complex realities of social justice movements.
A proper Venn diagram analysis might have revealed that the intersection of these elements was essentially empty, potentially saving the company millions in lost sales and reputation damage[21][22].
The Misguided Audience Assumptions
Several companies have failed spectacularly by assuming audience overlaps that don’t exist in reality. One fashion retailer created a campaign targeting “eco-conscious luxury shoppers” and “fast fashion enthusiasts” – two circles with virtually no meaningful intersection. The campaign confused both audiences and achieved neither sustainability credibility nor fast fashion appeal[20].
The Complexity Trap
Some marketing teams create overly complex Venn diagrams with four, five, or more overlapping circles. While mathematically possible, these become visually confusing and practically useless. One technology company created a seven-circle diagram for their product positioning that was so complex nobody could understand it, let alone act on it[23].
The resulting marketing messages were muddled, the sales team couldn’t explain the product clearly, and the campaign failed to gain traction. Sometimes simplicity is genuinely better than comprehensiveness.
The Funny: Marketing Venn Diagrams Gone Hilariously Wrong
The Accidental Truth-Telling
One of the most memorable Venn diagram failures occurred when a marketing team created what they thought was a sophisticated audience analysis but accidentally revealed uncomfortable truths about their brand positioning. The diagram showed three circles: “people who use our product,” “people who recommend our product,” and “people who pay full price for our product.” The overlap was embarrassingly small, essentially admitting that most customers only bought on discount and rarely recommended the brand to others[24].
Rather than hide this insight, the company used it as the foundation for a brutally honest rebranding campaign that actually increased customer loyalty. Sometimes accidents create the best marketing strategies.
The Meme That Became Marketing Gold
Several brands have accidentally created viral Venn diagram memes through poorly thought-out campaigns. One fast-food chain created a diagram showing “people who love burgers,” “people who love health food,” and “our target customer” with their customer sitting entirely in the health food circle. The internet’s response was swift and merciless, but the meme generated more brand awareness than their original £2 million advertising campaign[24].
The company eventually embraced the joke, using self-deprecating humour in subsequent campaigns that resonated much better with their actual customer base.
The Dating App Disaster
A dating app created a marketing campaign using a Venn diagram showing “people looking for love,” “people using dating apps,” and “people who find lasting relationships.” The intersection was depicted as surprisingly small, which was meant to position their app as the solution but instead highlighted the general futility of online dating.
The campaign became a source of internet comedy gold, with users creating parody versions showing the real intersections: “people who swipe right,” “people who actually meet,” and “people who don’t ghost each other” – with virtually no overlap[25].
The Art and Science of Marketing Venn Diagrams
When They Work Best
Successful marketing Venn diagrams share several characteristics. They address genuinely overlapping concepts rather than forcing connections that don’t exist[26]. They’re simple enough to understand quickly but sophisticated enough to provide real insights. Most importantly, they help teams make better decisions rather than just looking clever in presentations.
The best marketing Venn diagrams also evolve based on real data rather than assumptions. Teams that regularly test and refine their diagrams based on campaign results tend to achieve better outcomes than those who create them once and never revisit them[26].
The Human Element
What makes Venn diagrams particularly powerful in marketing is their ability to represent human behaviour and preferences visually. Unlike other business functions that deal primarily with processes or systems, marketing is fundamentally about understanding people – their needs, desires, and decision-making patterns[27].
This human element explains why marketing teams gravitate toward Venn diagrams more than finance, operations, or legal departments. Marketing professionals intuitively understand that customer behaviour exists in overlapping segments rather than neat, separate categories[28].
The Future of Visual Marketing Analysis
As marketing becomes increasingly data-driven, Venn diagrams are evolving beyond simple circle overlaps. Modern marketing teams use interactive, dynamic versions that can show how audience segments shift over time or how campaign performance varies across different overlapping groups[29].
However, the fundamental appeal remains unchanged: the ability to visualise complex relationships in a way that facilitates better decision-making and clearer communication with stakeholders.
Key Takeaways for Modern Marketers
Marketing teams love Venn diagrams because they solve a uniquely marketing problem: visualising the complex, interconnected nature of customer behaviour, market dynamics, and campaign effectiveness. When used thoughtfully, they provide clarity in complexity and help identify opportunities that might otherwise be missed.
The failures tend to occur when teams force connections that don’t exist, create overly complex diagrams, or use them as decoration rather than analytical tools. The funniest failures often happen when diagrams accidentally reveal uncomfortable truths about brand positioning or customer behaviour.
For marketing professionals, the lesson is clear: embrace Venn diagrams as powerful analytical tools, but use them with honesty, simplicity, and regular testing against real-world results. They’re most effective when they illuminate genuine insights rather than supporting preconceived notions.
The next time you’re struggling to understand your audience segments, competitive positioning, or channel strategy, remember that sometimes the simplest visual tools provide the clearest insights. Just ensure your circles actually overlap in meaningful ways – your customers, your colleagues, and your campaign results will thank you for it.
References and Further Reading
[1] Venn Diagrams in Business: How They’re Used to Visualize Data https://cpp-luxury.com/venn-diagrams-in-business-how-theyre-used-to-visualize-data/
[2] How to create Venn diagrams that compare and contrast your visual … https://fastercapital.com/content/Venn-diagrams–How-to-create-Venn-diagrams-that-compare-and-contrast-your-visual-content-marketing-strategy.html
[3] Why Great Sports Marketing Starts with a Venn Diagram (Seriously) https://www.firstfivemarketing.com/blog/the-venn-diagram-of-sports-marketing
[4] BEST 10 Venn Diagram Templates & Examples | Miro 2025 https://miro.com/templates/venn-diagram/
[5] 5 Ways Venn Diagram Applies To Business | Sammy Purple – LinkedIn https://www.linkedin.com/posts/sammypurple_5-ways-venn-diagram-applies-to-business-im-activity-7132658088985174016-5Xi_
[6] Event Venn Diagrams / Products & Marketing / Testing Goals https://www.linkedin.com/pulse/chlo%C3%ABs-3-things-event-venn-diagrams-products-marketing-chlo%C3%AB-thomas-7xw2e
[7] Venn Diagram Examples | Adobe Express https://www.adobe.com/uk/express/discover/examples/diagram/venn
[8] Venn diagram for three categories segmentation – infoDiagram https://www.infodiagram.com/slides/venn-diagram-segmentation/
[9] Venn’s diagrams should be used as creative thinking tools – WARC https://www.warc.com/newsandopinion/opinion/venns-diagrams-should-be-used-as-creative-thinking-tools/en-gb/2582
[10] What Is a Venn Diagram? Meaning, Examples, and Uses https://www.investopedia.com/terms/v/venn-diagram.asp
[11] A Venn-diagram approach to monitor brand associations https://www.sciencedirect.com/science/article/pii/S0263237322000500
[12] 59 Marketing Diagrams and Charts that Explain Digital Marketing https://www.orbitmedia.com/blog/marketing-diagrams/
[13] Venn Diagram for Authentic Business – George Kao https://www.georgekao.com/blog/venndiagram
[14] Customer segmentation analysis: an actionable guide – Zendesk https://www.zendesk.co.uk/blog/run-actionable-customer-segmentation-analysis/
[15] Best of Marketing | I posted the venn diagram a few days ago without … https://www.instagram.com/p/C-2au1JI2TX/
[16] How to Create a Venn Diagram for Business Use – Venngage https://venngage.com/blog/venn-diagram/
[17] Venn diagram template | Mural https://www.mural.co/templates/venn-diagram
[18] Use This Venn Diagram to Determine Your Content Strategy Pillars https://contently.com/2020/01/14/venn-diagram-content-marketing-pillars/
[19] Exploring Venn Circles: A Guide to 4-Way Venn Diagrams – Boardmix https://boardmix.com/articles/venn-circles-4-ways-venn-diagram/
[20] Failed Marketing Campaigns of 2023 | Interact Digital https://interact-digital.co.uk/failed-marketing-campaigns-of-2023/
[21] 13 Failed Marketing Campaigns: Reasons And Lessons https://www.audiencescience.com/failed-marketing-campaigns/
[22] The 13 Most Famous Marketing Fails in History (And How to Avoid … https://www.designity.com/blog/the-13-most-famous-marketing-fails-in-history-and-how-to-avoid-them
[23] 15 Creative Venn Diagrams to Get You Thinking – Creately Blog https://creately.com/blog/meeting-visual-collaboration/creative-venn-diagrams/
[24] People Are Cracking Up At These 31 Venn Diagrams That Are More … https://www.boredpanda.com/venn-diagram-meme/
[25] Funny Venn diagrams to inspire you – Nulab https://nulab.com/learn/design-and-ux/funny-venn-diagrams-to-inspire-you/
[26] Venn Diagram: Make efficient connections between things – Articles https://klaxoon.com/community-content/venn-diagram-make-efficient-connections-between-things
[27] Venn Diagrams: Unlocking Business Insights in Data Visualization https://www.venndiagramllc.com/sb/unlocking-business-insights-the-power-of-venn-diagrams-in-data-visualization/
[28] What is a Venn diagram? – MindManager Blog https://blog.mindmanager.com/venn-diagrams/
[29] Venn Diagrams – Progress over the Years – Apteco https://www.apteco.de/ressourcen/blog/possibly-best-venn-ever
[30] 13 Scarily Good Brand Marketing Campaigns To Remember https://www.canny-creative.com/13-scarily-good-brand-marketing-campaigns-remember/



Leave a Reply